
The bubble chart is the visualisation of wheat available/person as population increase in the period of 28 years in the districts producing wheat.
Note: The content of this page will be refined over time.
On average Pakistani nation consume 130 kgs of wheat per person every year. At least that’s what was posted on this forum https://defence.pk/pdf/threads/an-average-pakistani-consumes-130-kilos-of-wheat-per-year.506129/.
Let’s, attempt to answer the question. Do the districts produce surplus amount of wheat?
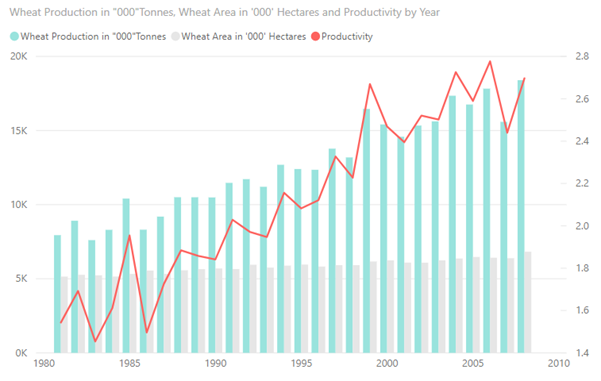
We start by examining how much Wheat Pakistan has produced over the period of 28 years on year on year basis. In the year 2008 the production was 23,234.70 metric tonnes(‘000) and in 1981 the production was 10,873.50 (‘000).
In the period of 28 years the wheat production grew by 113%.
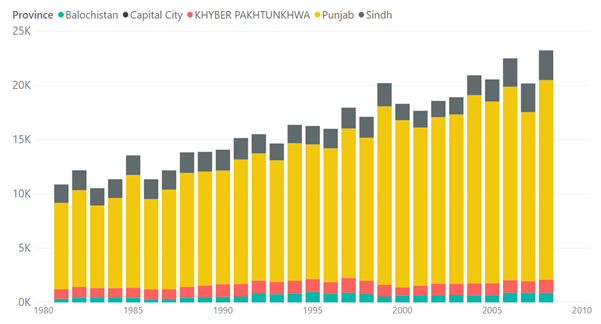
This number doesn’t reveal much about how this growth was achieved, so let’s bring the land data into the equation.
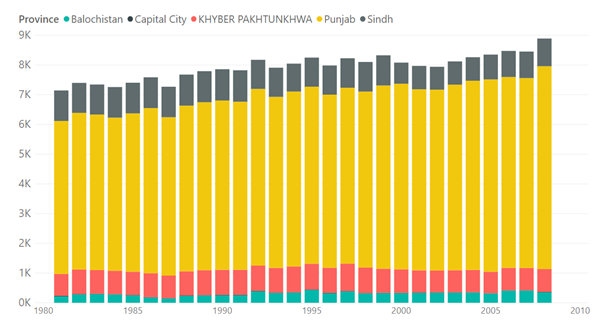
Land was measured in hectors so between 1981 and 2008 the land coverage increased from 7143.40 (‘000) hectors to 8890.30 (‘000) hectors.
The resulted in the growth by 24.45% with the majority of the growth in Punjab province.
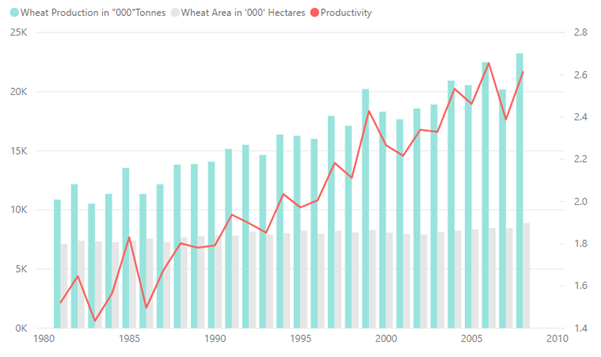
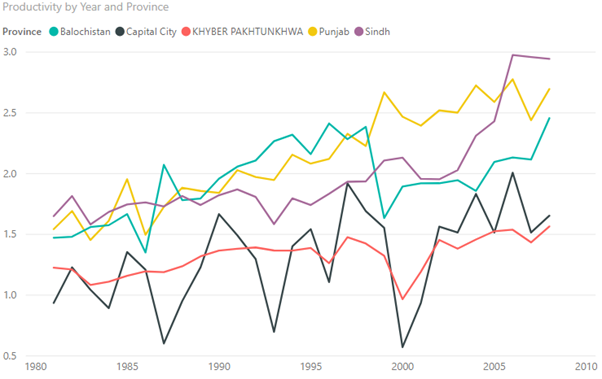
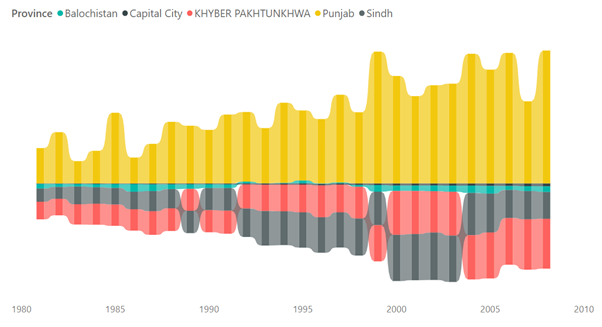
We can also look at how much efficiently was the land used, I am talking about productivity now. In the below, we see the total production in green and land data in grey while productivity can be seen in red. It can be seen land utilisation grew in the period of 28 years. Is this utilisation same across all provinces? Let’s have a look.
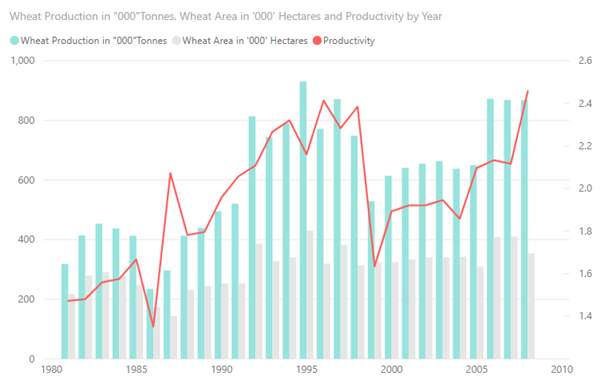
Baluchistan didn’t see any noticeable increase in the more recent 15 year period and both production and productivity suffered, causes yet remained to be explored.
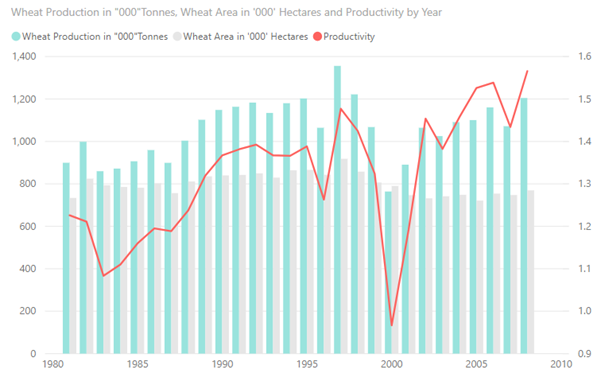
In the KPK data, I was expecting to see a fall from years 2004 to 2007 as during this period there was a massive earthquake and a period of flooding, but data didn’t show an impact of these calamities.
KPK didn’t witnessed growth in productivity but yet province similar to Baluchistan failed increase land area to increase further production.
There has been a gradual increase in the land area but a significant was observed during the period of 2003 to 2006.
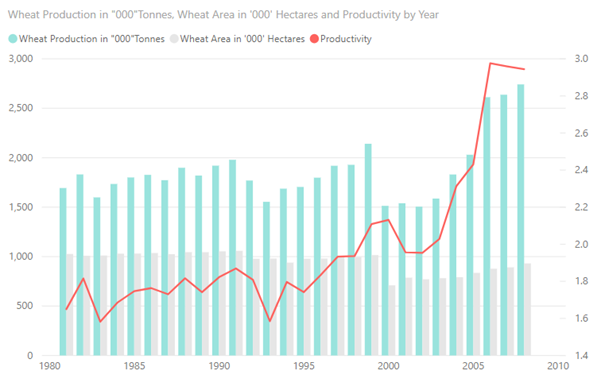
Consistent growth in land and production resulting in increased productivity can be observed.
This is how productivity lines of all provinces look like which is pretty much self-explanatory.
Now, we know that Pakistan consumes 130 kgs of wheat per person every year. I’ll be using this number with a lot of reservation but I presume that actual data will not be much far off from this average either.
Before answering for districts lets answer the same question for provinces.
Do the districts produce surplus amount of wheat?
Yes, there is a surplus income to trade with provinces which do not produce wheat at all but as it can be seen there has been a effort made to increase production in Punjab but it is not true for the remaining provinces.
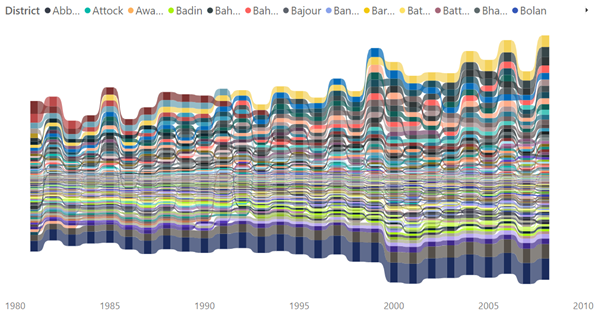
Since we have come this far let’s answer another question, which districts are the biggest consumers, and which are the largest producers of surplus wheat?
The middle area of the diagram is zero(0) anything growing above it is surplus and anything below it is a consumer. The biggest consumers are Karachi and Lahore districts while the largest producers are Jhang, Sheikhupura, Bahawalnagar, Bahawalpur to name the few.
Coming back to the bubble chart, here are bubble charts for each province.
Data Source:
Wheat Production for the past 28 years.
http://www.pbs.gov.pk/agri-stat-publications
Population data:
Census of 1951 to 1998
http://www.pbs.gov.pk/sites/default/files//tables/POPULATION%20BY%20PROVINCE%20REGION%20SINCE%201951.pdf
Census of 2017
http://www.pbs.gov.pk/content/block-wise-provisional-summary-results-6th-population-housing-census-2017-january-03-2018